When do most vehicular accidents in NYC happen?
My data source is the NYPD vehicular collision dataset ranging from July 1, 2012 - December 6, 2016.


What day in the week has the most vehicular accidents? Is it Friday when people are gearing up for a night out? Or is it Monday when people are groggy from sleeping in on the weekend and rushing to work? What day in the week has the least vehicular accidents? To answer this question, see the horizontal bar plots below illustrating percent of accidents by day of week across years.

From the results in the bar plots, these are the main findings consistent year over year:
Note that the findings don't necessarily mean that you are less likely to get in a vehicle collision on Sunday versus Friday, only that the absolute volume of vehicle collisions is lower.
We would expect most accidents to occur during hours where more people are driving/commuting. Since most people neither work nor go to school on weekends, we would also want to look at weekdays and weekends separately. Which hours have the most/least accidents? Do we find any differences between weekends and weekdays? Are findings consistent across years (2012-2016)?
Below you can see colored bar plots of the yearly percent of vehicular accidents (y-axis) by hour of the day (x-axis). The hour of the day is expressed such that hour 0 is between 12:00 am to 12:59 am and hour 23 is between 11:00 pm - 11:59 pm . The bar colors range from dark green (least) to dark red (most) to accentuate the variance across the hours of the day. The top graph shows weekdays, while the bottom shows weekends.


From the results in the bar plots, below are the main findings that are consistent year over year.
- 2 pm as well as 4-5 pm are when most vehicular accidents occur year over year.
- There is an 8-9 am spike in accidents on weekends that is not present on weekends.
- The hour with the least percent of accidents shifts from 3 am on weekdays to 7 am on weekends.
What day in the week has the most vehicular accidents? Is it Friday when people are gearing up for a night out? Or is it Monday when people are groggy from sleeping in on the weekend and rushing to work? What day in the week has the least vehicular accidents? To answer this question, see the horizontal bar plots below illustrating percent of accidents by day of week across years.

From the results in the bar plots, these are the main findings consistent year over year:
- Friday had the most vehicular accidents
- Sunday had the least vehicular accidents
Note that the findings don't necessarily mean that you are less likely to get in a vehicle collision on Sunday versus Friday, only that the absolute volume of vehicle collisions is lower.

NYC does have seasons, with ice and snow being common in the winter months. Do hazardous driving conditions during winter months suggest an increase in vehicular accidents compared to warmer months? Or do people counteract the increased risk by driving less and/or more carefully? To answer this question, let's take a look at the percent of accidents by the month of each full year in the dataset (2013-2015):

Finding:
- Year over year, the months between January and April (the colder, more hazardous months) have less accidents as compared to all other months.
From the result, 4 possibilities come to mind, that may all have a synergistic effect:

- People commute less during colder months
- People participate more heavily in public transportation during colder months
- Anticipating increased risk from ice, etc., people drive more carefully when it's colder outside
- The number of tourists, pedestrians, and cyclists are greatly reduced...making roadways safer
Finally, is there a decrease or in vehicular accidents in NYC year over year? One would think that with the introduction of safer, smarter cars and gps systems that there would be less accidents in NYC across the years. Let's see if this holds true across the full years in the dataset (2013-2015):

Finding:
This is a good reminder for us all that technological advances should not reduce our vigilance for road safety.
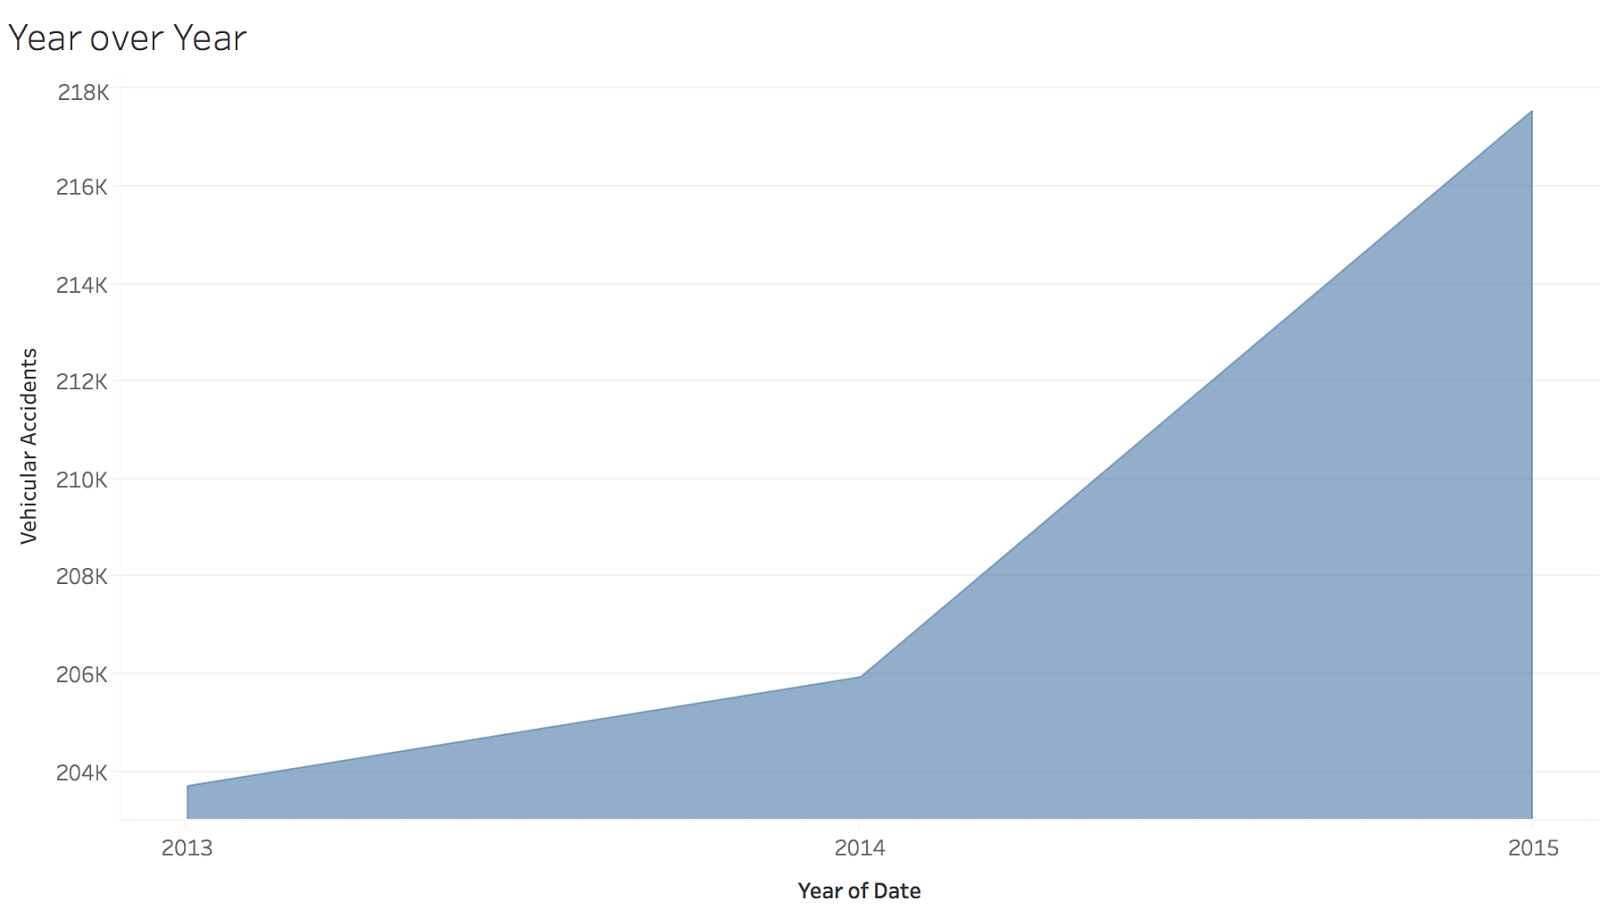
Finding:
- Vehicular accidents increased ~6.8% between 2013 and 2015 from around ~204K to ~218K accidents.
This is a good reminder for us all that technological advances should not reduce our vigilance for road safety.
*On a final note, nothing about these descriptive statistics have any directly tested correlation to risk or accident likelihood. For example, just because there were more accidents in East New York at 4-5 pm on a Friday in May, doesn't necessarily mean your risk of getting into an accident under those circumstances is increased. Other factors come into play, with one example being the number of vehicles, pedestrians, and cyclists on the road at any given time.
No comments:
Post a Comment